Portfolio
Data visualisation on baby smiles
I decided to record every smile and cry of my seven month old baby and turned it into a data visualisation. For the design I was inspired by a baby mobile. Each string on the mobile is an hour and each bead is a record. I decided to have fun with this one and even made it interactive!
Data analysis and visualisation of a yearly trade fair
Some of the visualisations made for the analysis of a yearly trade fair of a Conservatoire. Numbers have been obfuscated.
Data visualisation on cardiovascular diseases
Made my own data visualisation about this topic as an assignment for a course.
Infographic
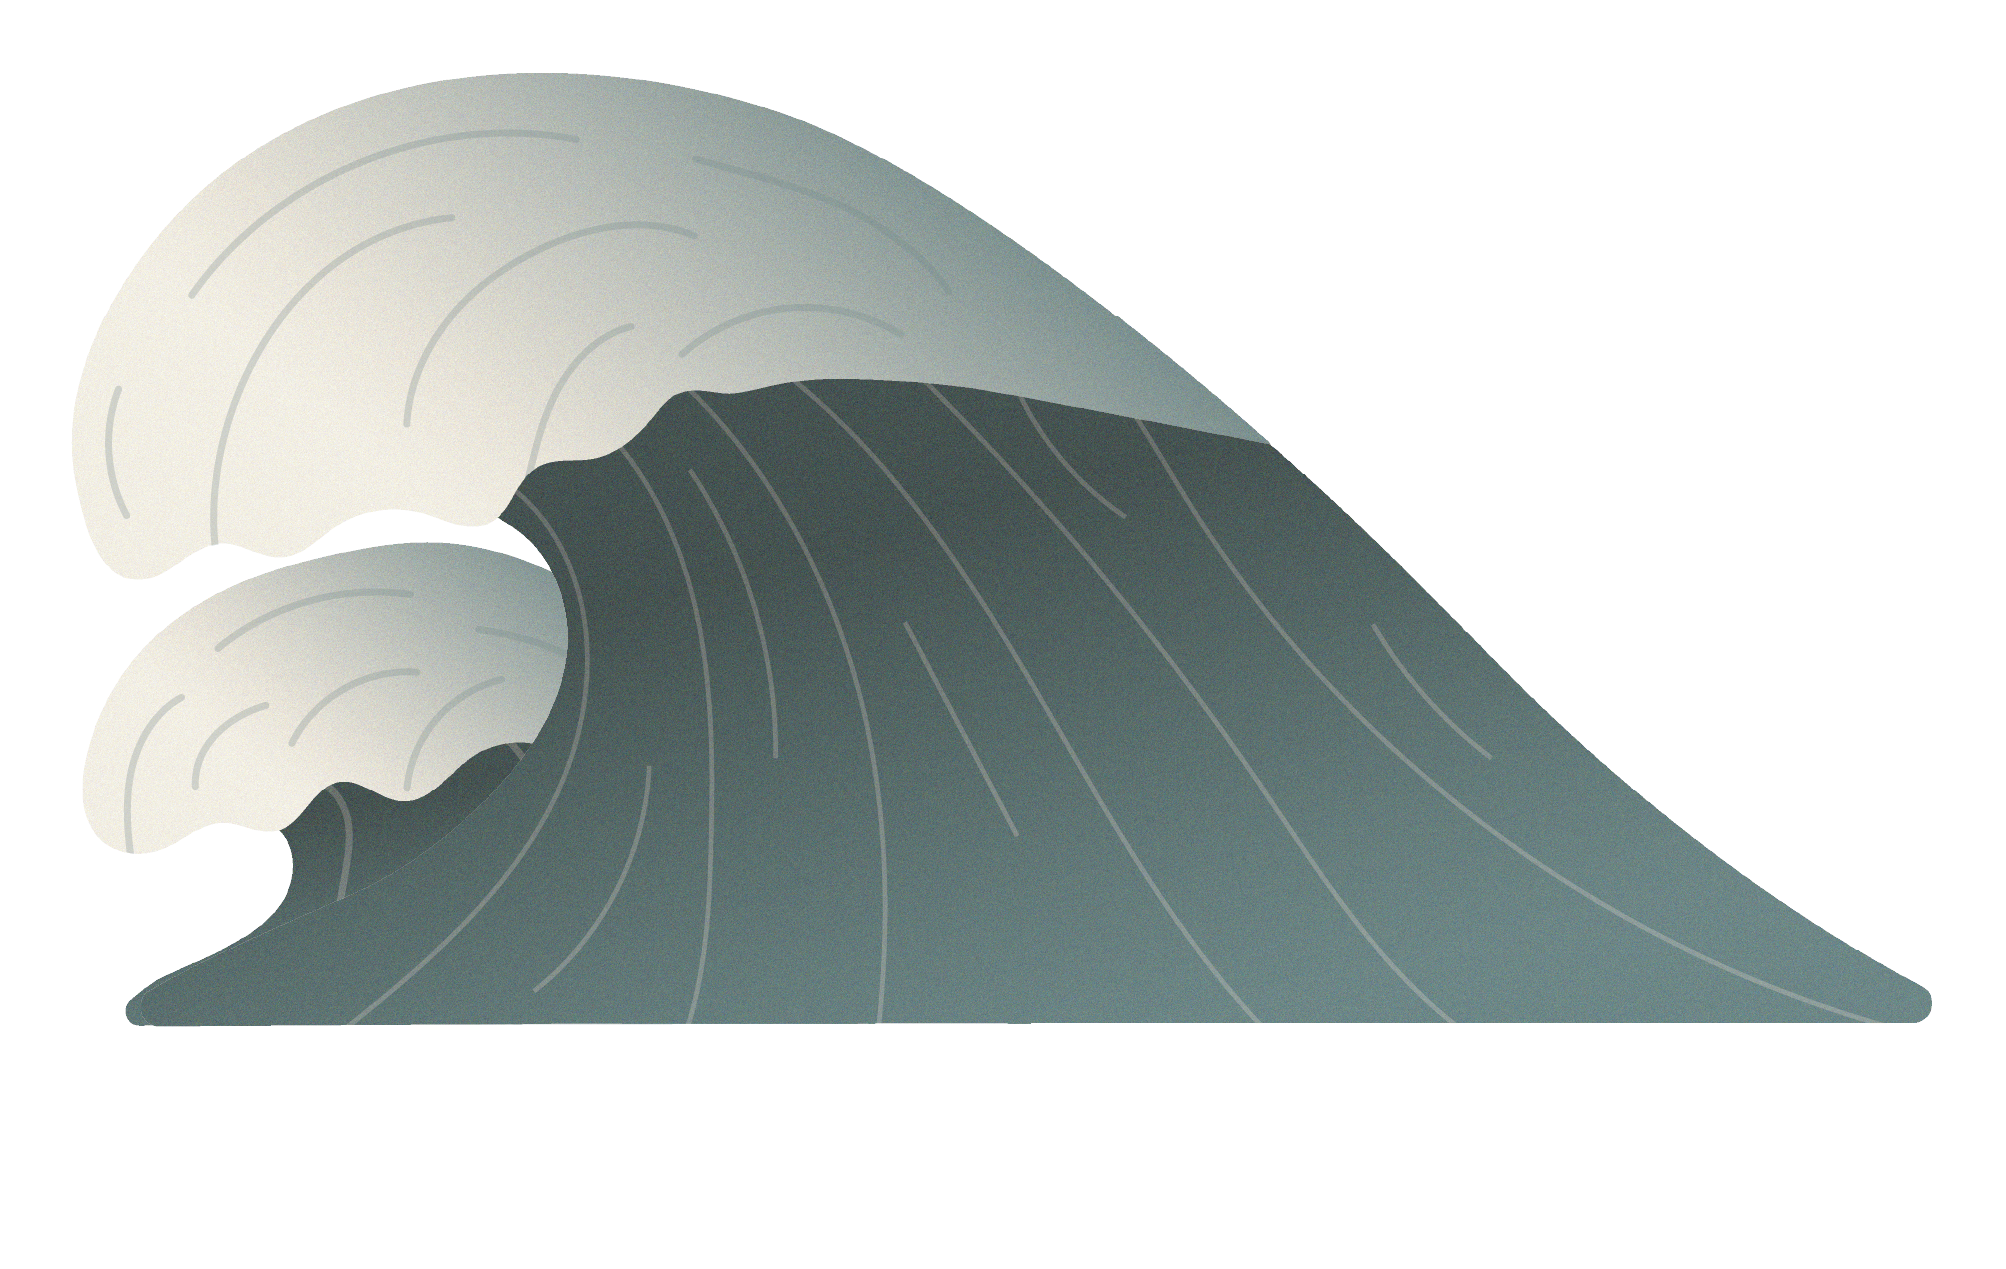
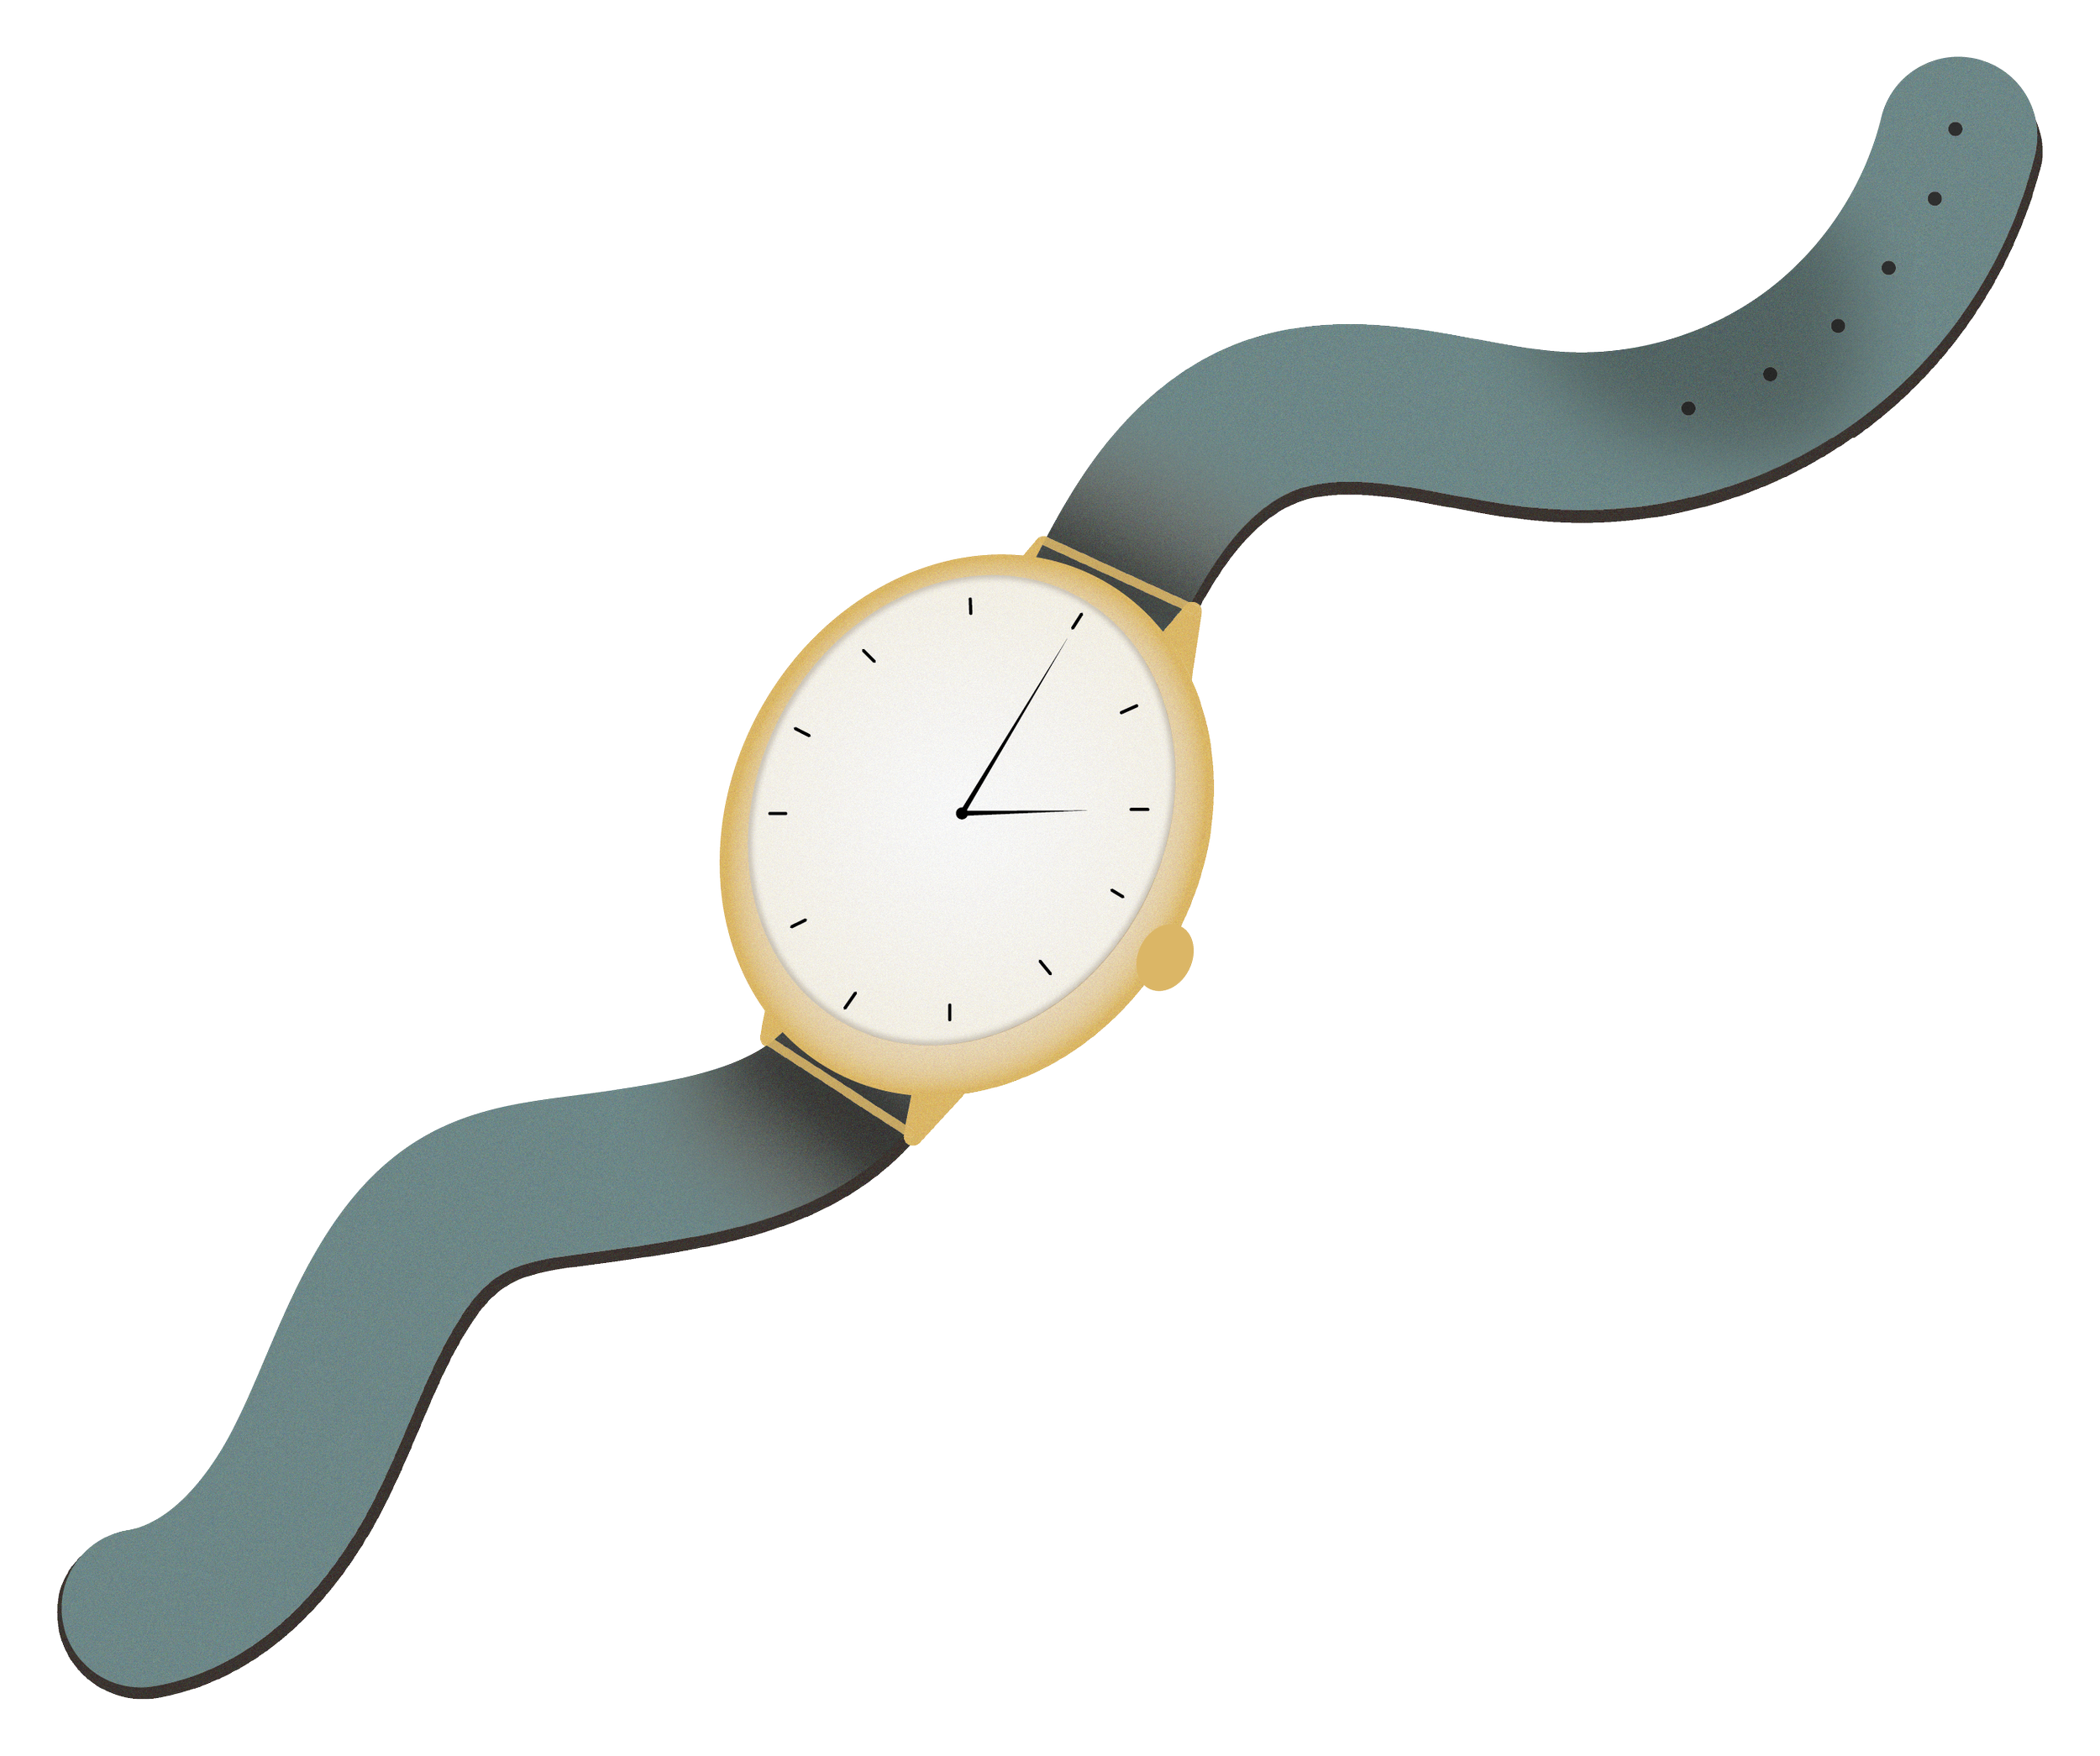
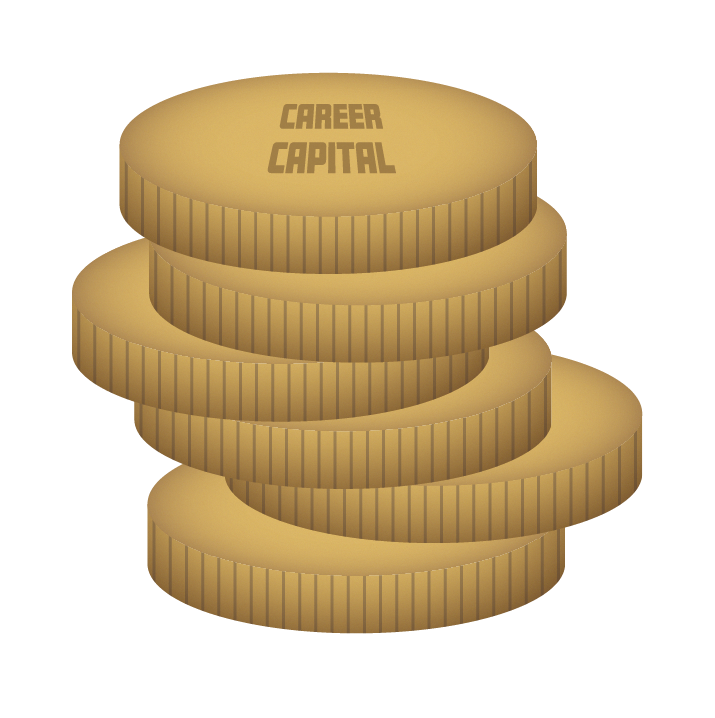
Made an infographic about one of my favourite non-fiction books “so good they can’t ignore you” by Cal Newport. It includes my own custom illustrations.
Presentation template for Eezee-It
Objective: create presentation templates in PowerPoint that are easy to use and align with the client’s new branding.
Deliverables:
General template with 42 Slide Master slides.
Ready to use sales deck.
Appendix slides with branded icons, illustrations, shapes and tables.
Guide on how to use the template.
Presentation slides for Personal Branding class
Presentation slides for a guest lecture on Personal Branding. The final deck supported the content of the guest lecture, appealed to the target audience (Master students Music and Jazz) and could be studied by students afterwards.